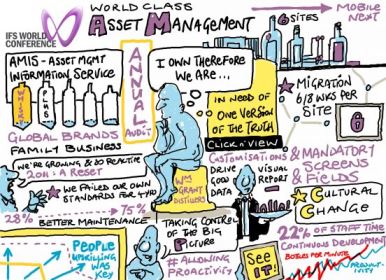
A case study of using IFS in asset management, given by two customers from William Grant & Sons at the IFS World Conference 2016.
William French
The view from maintenance
William Grant & Sons – a family-owned business for five generations. It was founded in 1886 and has been exporting since 1901. It’s been expanding and acquiring brands, and building distilleries in Scotland and now Ireland. They’re a global company, with production facilities around the world, with supply hubs to support them.
AMIS is the Asset Management Information Service we use to assess our performance. It benchmarks you against a range of comparables. Their main packaging facility in central Scotland produces 14 million crates of whiskey per annum. In five audits, over five years, we’ve achieved world-class status in our asset management. Why? Legislative compliance, brand safety, adopting world-class processes – and a burning platform in terms of our growth in comparison with the facilities we have.
Our first audit in 2011 only got us 28% – the “reactive zone”. We had a very efficient fire-fighting approach but no sense of preventative maintenance. We changed some systems and merged some teams and that got us to 41%. We added weekly planning of maintenance, changed the shift rotas, including one to look at process improvements.
AMIS – beyond the 50% mark
This brought us to 54%. We’re taking more control now, and weekly planning was being developed and increased. Maintenance and operations are working closer together, and continuous improvement started becoming a concept for the business. By 2014 we’re on 68%. Mean time to repair and mean time between failures are being monitored – but initially manually in Excel spreadsheets. Weekly planning is now 80% embedded in many areas. Materials management projects are being completed and global KPIs added – and all of this is driving us towards for IFS.
Mark Quinn
The view from business systems
We were using a limited license, unsupported system. We were already using IFS for some parts of the business, so bringing maintenance in made sense. We could start getting greater visibility across the sites. And now we could align maintenance with the rest of our technology roadmap. We started with a steering group that selected IFS and set up a project team. One key discussion was the numbering systems and a hierarchy of the assets. There were a lot of discussions…
We chose to run IFS with configurations, not customizations. We used profile configurations to reduce screen clutter. We added shortcuts based on role and location amongst others.
Getting implementation right – and tight
For each site, implementation was about 6 to 8 weeks. Preparation included: export of data from the legacy system, validating it, converting it to IFS standards and load to a test environment to test. Once it was validated within IFS Applications, it was tested by the on-site team and then an agreement was given for pushing it to live. The team stayed on site for some weeks to offer support. We’re done in many of our distilleries, with Tullamore on the agenda for early next year.
The project is on time and on budget. All sites are now using the same system, with full visibility across all sites. KPI reporting is significantly better and the mandatory fields have been invaluable in ensuring technicians capture needed data.
William French
I love the mandatory fields. We worked back from what we wanted out of the system and used that to define what was mandatory. It got people into the IFS mindset.
By 2015 we were at World Class – and some of our areas are above exceptional. 2014/15 was a critical period. We drove through FMECA, we trained everybody and developed an autonomous maintenance training area. Visual performance indicators mean performance boards that make it really easy to see how everyone is doing.
Shift communication techniques were developed, which included capturing videos and photographs of key issues to pass between shifts.
Benefits to the business
Cost to CARV is at 3.1%, against a benchmark of 3%.
Total maintenance costs against total manufacturing costs are at 10% of the benchmark of 10 to 15% – on the low end. Maintenance is not sucking the life out of the business. Engineering downtime is down. And 22% of the time is now spent on continuous improvement.
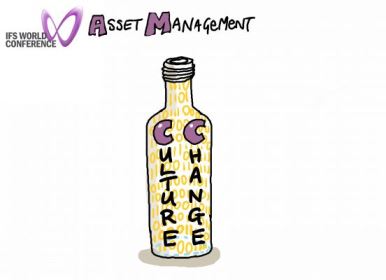
We’ve improved the bottles per minute against the theoretically available time significantly through this process. Reporting improvement mean is much easier to spot persistent problems and apply resources to resolving them. Basically, it’s a culture change – we’re now a data-driven maintenance team, which turns to IFS first to figure out what needs doing.
For example, we have labeling assets from different manufacturers. We can now see how they perform over time – which means it will change how we do supplier selection.
It’s hard to argue with data. We pull the data out of the systems and it takes the emotions and perceptions out of the story.